3 minutes
The Missing Bits:Part 2
We now know the basics but that’s not enough we’ve to dig a little deeper. Data is being pushed and popped out of the stack as a program executes. But have you ever wondered how the system keeps track of this execution? That’s when registers come into play. Registers are small memory units in the CPU capable of holding a small amount of data (memory addresses). As a program execute these registers instruct the system what to execute next and where to return after a function terminates. There are different classes of registers, but we will be considering rbp ,rsp and rip registers.
rbp(base pointer)is the base pointer, which points to the base of the current stack framersp(stack pointer) always points to the top of the stack, which will change any time a word or address is pushed or popped onto/off of the stack.rip(Instruction pointer) is the register that tells the system where to go next to execute the next command. It controls the flow of execution.
All these terms can be a little confusing. But believe me, things will get much easier as we proceed.
The stack
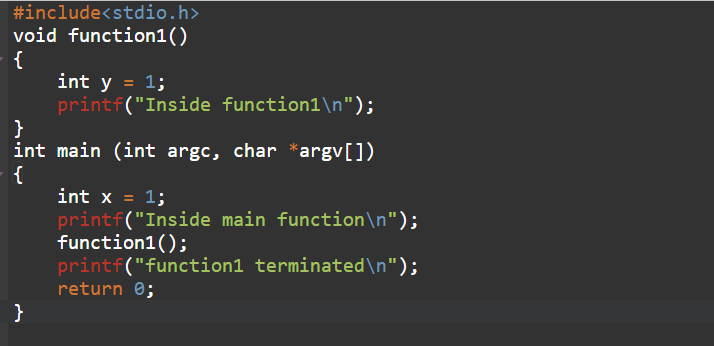
Let’s see what happens in the stack with the help of a C program,

- The main function will start first, the variable x will be pushed into the stack, and it will print out the sentence “Inside main function”,

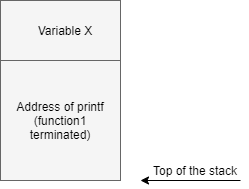
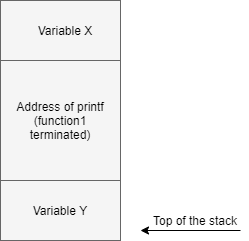
- The main function will then call function1 and before moving forward to function1, the address of printf(“function1 terminated”) will be saved into the stack to continue the execution flow. Now control will move forward to execute function1 by pushing the variable y into the stack and then execute printf(“Inside function1\n”), as shown in the following diagram:

- After executing printf(“Inside function1\n”) funtion1 will exit, removing the function’s stack frame. Then, go back to the main function to execute printf(" function1 terminated") and exit. Resulting in successful execution.
Registers

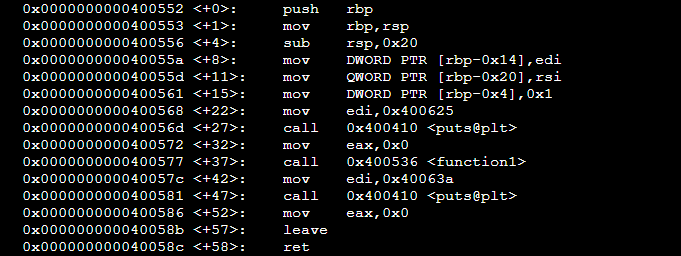
At the beginning of execution the registers rbp and rsp are initialized.rbp remaining unchanged the rsp changes rapidly as PUSH and POP operations take place.rip contains the address of the instruction following the CALL instruction. That is, rip decide what to execute next. During program executions rip value is determined by the system. But what if we could control rip and make the system execute something we desire?
That is exactly what we will achieve using a buffer overflow attack. We will take control of rip and make it point to a different location containing malicious code.
Environment setup
Before proceeding any further let’s take a little peek into the environment setup. Buffer overflow is a memory exploit, so we need to understand what is going on in memory. We will be using GDB for debugging purposes along with peda.py, a plugin for the debugger. We will use execstack to make the stack executable.
Installation
Assumption : you are using Linux system
- GDB
sudo apt-get update
sudo apt-get install gdb

Basic GDB commands
------------------------------------------------------------------------------
break(b) : Used to set breakpoints in the program.
continue(c) : Resume execution
disassemble(disas) : Used to disassemble a function.
help(h) : List of classes of commands
info registers(i r) : Displays the current contents of the CPU registers.
list(l) : To print lines from a source file. By default, ten lines are printed
run(r) : Used to run the program under gdb.
- peda
git clone https://github.com/longld/peda.git ~/peda
echo "source ~/peda/peda.py" >> ~/.gdbinit
- execstack
sudo apt-get insatll execstack
Note: Demo uses a Linux x86_64 (arch) ubuntu 16.04(OS) machine.
that’s it for part 2, see you in part 3 😄